EMIR via Voltus-Fi
general terminology
DC related
Imax in T*'s DRC document is the maximum allowed DC current, which depends on Length and Width only
Iavg is the average value of the current, which is the effective DC current. Therefore, Iavg rules are identical to Imax rules \[ I_{\text{avg}}=\frac{\int_0^\tau I(t)dt}{\tau} \] Similarly, Iabsavg rules are identical to Imax rules, too \[ I_{\text{AbsAvg}}=\frac{\int_0^\tau |I(t)|dt}{\tau} \]
rms
Irms is the root-mean-square of the current through a metal line, which depends w(in um), the drawn width of the metal line and \(\Delta T\), the temperature rise due to Joule heating. \[ I_{\text{rms}}=\left[\frac{\int_0^\tau I(t)^2dt}{\tau} \right]^{1/2} \]
peak current
Ipeak in T*'s DRC document is the current at which a
metal line undergoes excessive Joule heating and can begin to melt.
Ipeak is corresponding to
EM Current Analysis: max in Voltus-Fi Analysis Setup \[
I_{\text{peak}}=\max(|I(t)|)
\] The limit for the peak current is \[
I_{\text{peak,limit}}=\frac{I_{\text{peak\_DC}}}{\sqrt{r
} }
\] where r is the duty ratio
The relationship between Ipeak and Ipeak_DC is merged in DRC document so that there is only Ipeak equation in document
\(I_{\text{peak,limit}}\) depends on \(t_D\), r, width and length
\[ r=\frac{t_D}{\tau} \]
where \(t_D\) is equivalent duration
\[
t_D =\frac{\int_0^\tau |I(t)|dt}{I_{\text{peak}}}
\] or \[
r=\frac{I_{\text{AbsAvg}}}{I_{\text{peak}}}
\] 
where the drawn width is 1um, r is 0.1
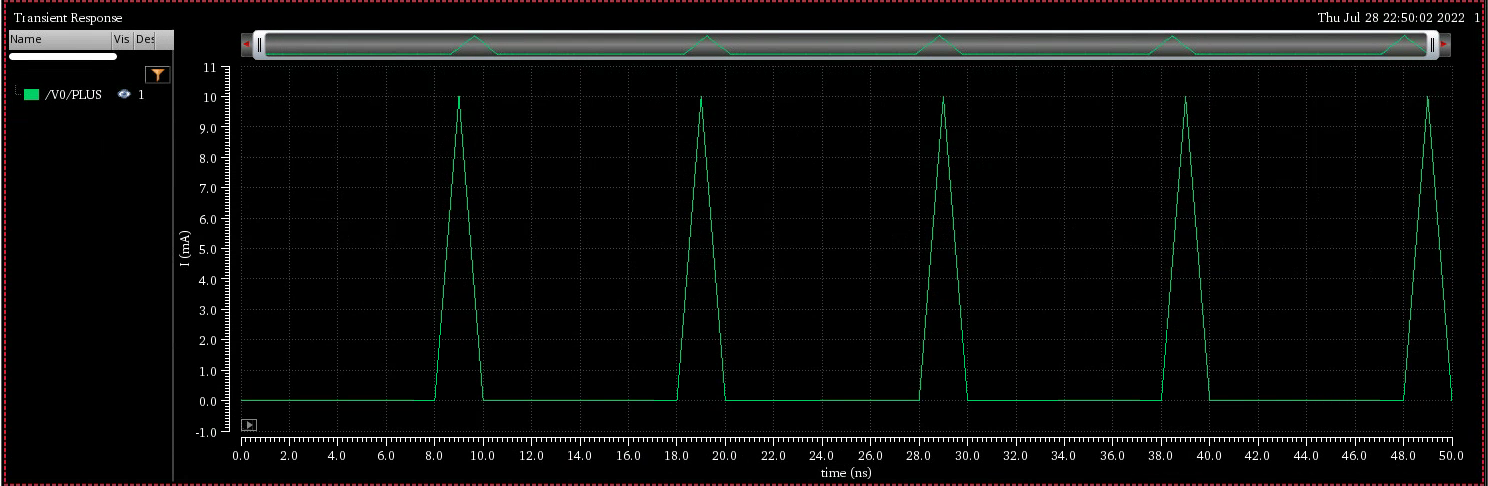
 \[
9.37*(1-0.004)/\sqrt0.1 = 29.512
\]
\[
9.37*(1-0.004)/\sqrt0.1 = 29.512
\]
acpeak/pwc
It's same with max EM Current Analysis in Voltus-Fi
dynamicACPeak
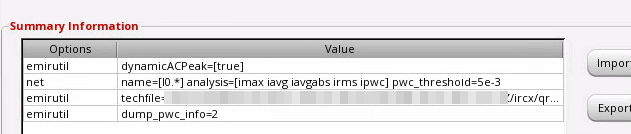
This option affect how duty ratio r is computed in max
and acpeak/pwc EM current Analysis
When the dynamicACPeak variable is set to
true or multiPeak \[
r=\frac{T_d}{T_{\text{total}}}
\]
where \(T_{\text{total}} = \text{EMIR time window}\)
\(T_d\) = the time duration in
microsecond of the total "On Time" period based on IPWC
Pulse-Wise Constant EM current calculation (IPWC)
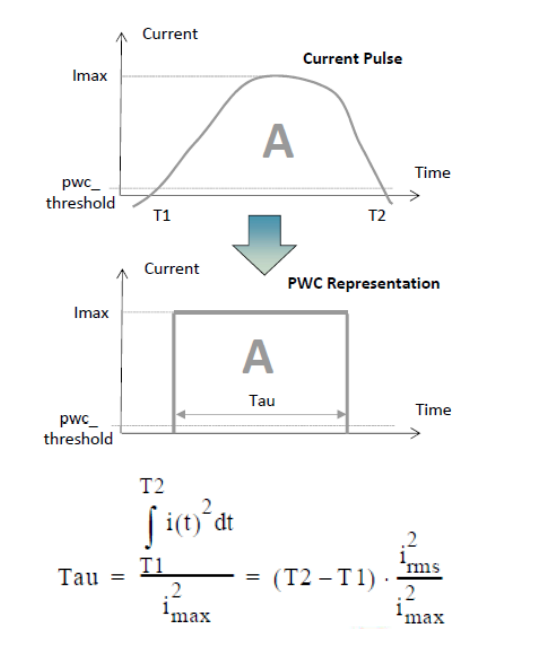
where Tau is \(T_d\) in above formula
!!! It seems that t*'s PDK don't support
dynamicACPeak=true
IR drop filter layers
EM techfile (qrcTechFile) may take diffusion contact (n_odtap, p_odtap in DSPF file) into account during IR drop analysis. And these segment often dominate IR drop, but we as IC designer can NOT improve them. In general, the IR drop to M1 layer is enough and feasible.
Regular analysis statements in emir configuration
1 | net name=[I0.vdd I0.vss] analysis=[vmax vavg] |
emirreport command
Creating reports for specific nets after simulation using
emirreport
Create a new config file as shown below:
1 | ** test.conf** |
Run emirreport on the command line using the
emirdatabase (emir*.bin) and test.conf
created above in
1 | % emirreport -64 -c test.conf -db <emirdatabase> -outdir newreport |
database
simulation result
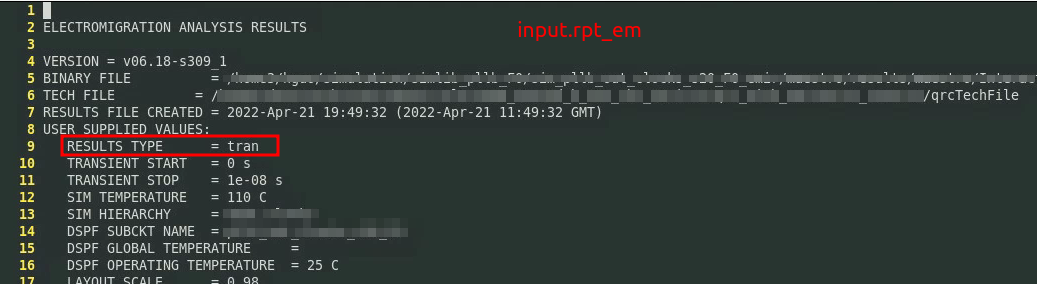
input.emir0_bin: The first EMIR Analysis which is DC or Transient, which depends on Analyses order
input_tran.emir0_bin: EMIR Analysis in Transient simulation
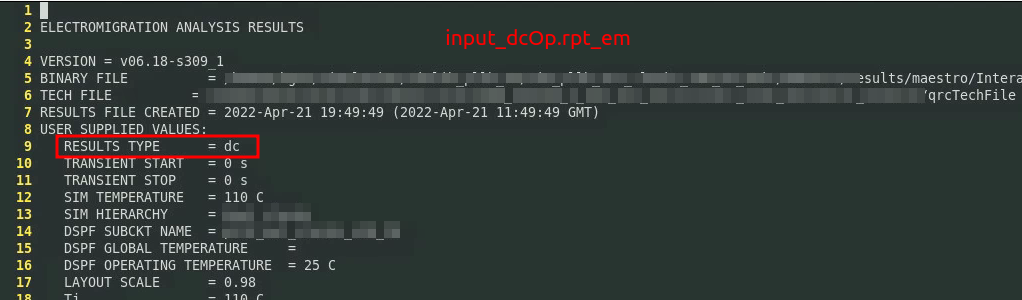
input_dcOp.emir0_bin: EMIR Analysis in DC simulation
For example
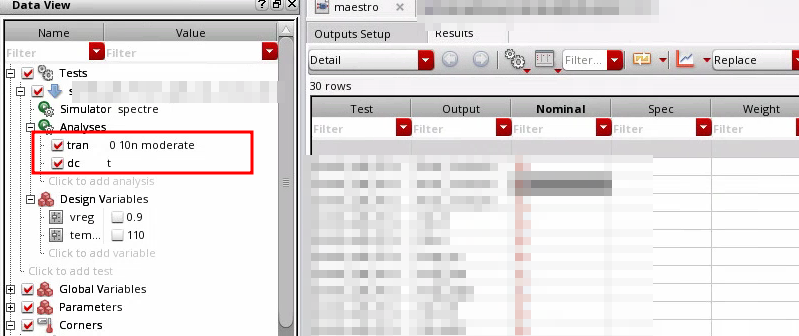
Two results are generated input.emir0_bin and
input_dcOp.emir0_bin and their reports respectly
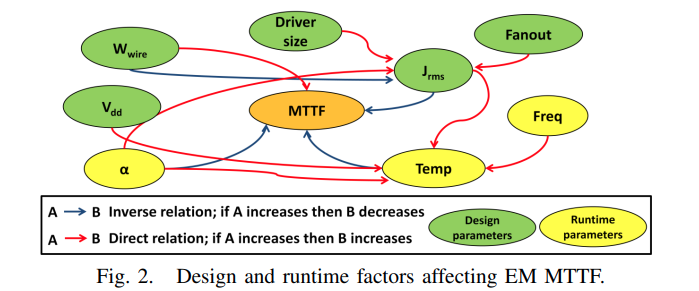
Fix Electromigration
| Type | wider wire | downsize drivers | decrease fanout |
|---|---|---|---|
| RJ JMAX | ✓ | ✓ | |
| JAVG | |||
| JABSAVG | |||
| JACPEAK | |||
| JACRMS | ✓ | ✓ | ✓ |
Iavg
The average value of the current, which is the effective DC current
Irms
Irms rule relates to the heat or Joule-heating of metal lines
Ipeak
The main goal of the Ipeak limits is to ensure that no thermal breakdown could occur on single overshoot events. If the signal may not have a high current density but if it has a very large peak current density, then, local melting will happen and cause failures
QA
Q. Why “length” column in EM results form doesn’t show extracted length, it shows “NA”.
A. Voltus-Fi reports the “length” column only when length rules are present in the emDataFile.
Seeing different port currents with and without emir simulations for same dspf included in EMIR Direct method using dspf_include.
Split Pins (*|P) in DSPF are only shorted in the EMIR flow not in the regular spectre flow. Islands patching is only performed in EMIR only
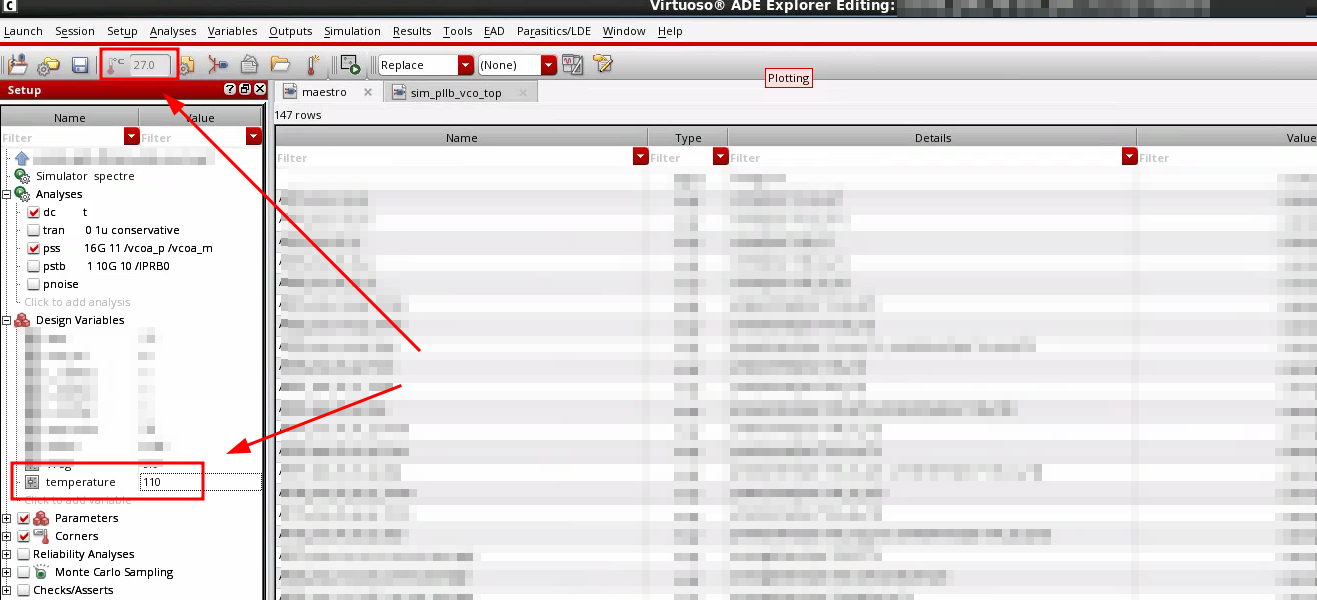
Setting temperature for EM analysis
By Default, Voltus-FI and VPS pick up the current density limit for temperature at which simulation has been performed.
By the way,
Design Variables- temperature will override the temperature in Setup toolbar which is gray in ADE Explorer
AC Peak EM analysis - Voltus-Fi
The available options within the EM current analysis section in the EMIR Analysis Setup form are:
max / avg / avgabs / rms.In order to enable the AC Peak based information when loading the EM results, both max and avg should be selected when setting up the EMIR Analysis Setup.
With this configuration, the AC Peak option becomes available and can be used.
How to print average, rms, and peak current of device tap in Spectre/Voltus FI EMIR analysis
The following option enables you to save the average, rms, and peak tap currents in the emir0bin file and report it in the input.rpt_tapi file.
1
solver report_tapi=true
Add this option in emir.conf to enable the reporting of tap current after the Spectre EMIR simulation. The input.rpt_tapi file will be saved in the psf/raw directory.
Note: This feature is supported in SPECTRE20.1 ISR14 and later versions.
emir.conf file
emir.conffile is generated automaticaly after configure EM/IR Analysis in ADE, which is in netlist directory.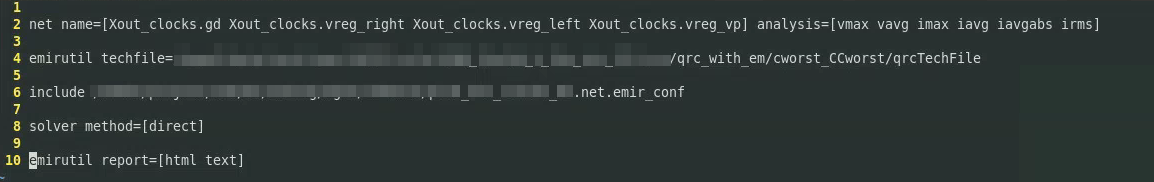
Setting default path for EM rules file in APS EMIR analysis
set the following environment variable in your terminal
1
setenv EMDATAFILE < path to EM rules file>
or set in
.cdsinit1
setShellEnvVar("EMDATAFILE=<path to EM rules file>")
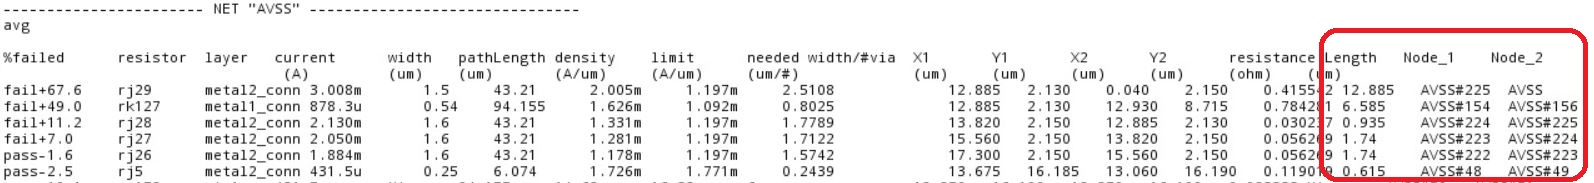
Print node names and length associated with parasitic resistors in EM report file
export CDS_MMSIM_VOLTUSFI_ROOT=$CDSHOMEPrinting the parasitic resistor length in the EM report
1
emirutil reportLength=true
Printing nodes that are associated with the parasitic resistor
1
emirutil reportNodeName=true
Once these are enabled, you will have the Length, Node_1, and Node_2 columns printed in the EM report file, as shown below:
Is it possible to run RMS IR Drop analysis using Voltus-Fi?
Typically, in a simulation, Power/Ground nets are always biased with a constant DC source. Hence, at present, Voltus-Fi only supports Average and Maximum (Peak) IR Drop analysis.
For a net to have data for IR analysis(vmax/vavg), the net/node must be connected to a DC vsource or a vsource which is constant within the emir time window.
Can we change the time window of EM computation after the simulation completed ?
It is not possible to modify the EM time window without re-running the full simulation.
However you can specify several time window in the emir conf file for instance for 2 time window [0 to 10n] and [10n 20n]
1
time window=[0 10n 10n 20n]
In that case it will create 2 emir_bin files and then 2 different em report files according to the 2 different time windows.
How to print segment_W values being used to compute EM limits
You can use the following option to print
segment_Wto the report:1
emirutil reportSegmentWidth=[true]
This would print a
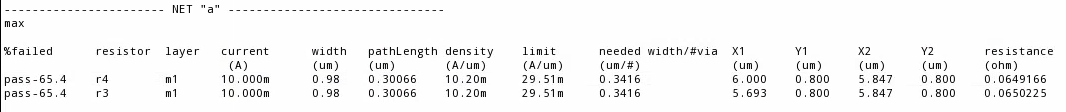
Segment_wcolumn in the report containing the segment width values used for computing the limit:Pass/Fail % Resistor layer Current Width PathLength I limit X1 Y1 X2 Y2 J/JMAX Res ViaArea No of needed vias width/#via J limit Segment_w (mA) (um) (um) (um) (um) (um) (um) (nm^2) (um/#) (A/um) pass-100.0 Rj3292 Met1 9.02376e-12 0.1 42.72 1.10067 0.350 11.568 0.350 11.376 8.19843e-12 0.7382 NA NA 0.0001 0.0110067 0.1 pathLength vs Length in EM report file
Length: parasitic resistor length, which is set by
emirutil reportLength=truepathlength: Blech length is also known as "Short length" or "Path length", and can be explained as : The longest and continuous centerline path from edge to edge among the connected wire shapes on the same metal layer.
- For all resistors falling on this shape, same pathLength is reported.
- After the longest path in shape has been determined the tool applies the same blech length to all the resistor falling on that shape.
- This resistor length is NOT used in EM analysis because EM rules consider Blech length of the resistor.
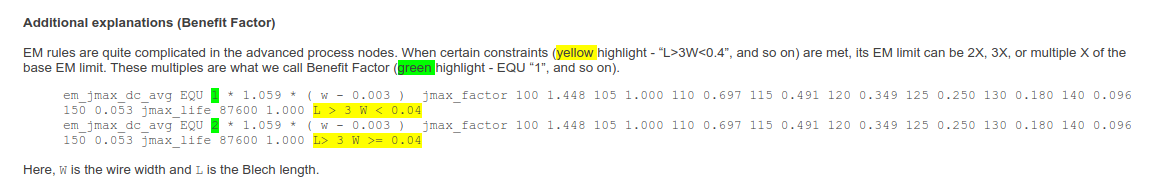
where W is the wire width and L is the Blech length.
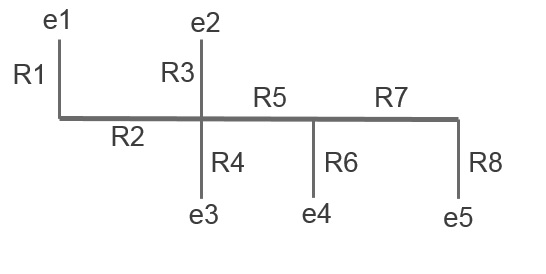
By default the tool will sum all branches of a given metal layer. In other words the path length that will be used to look up the EM density limit is :
Bl = $l(R1) + $l(R2) + $l(R3) + $l(R4) + $l(R5) + $l(R6) + $l(R7) + $l(R8)
How to enable EMIR analysis in PSS simualtion ?
To enable EMIR in PSS, you have to enable DC and/or Tran simulation simultaneously. Two or more binary results file should be generated and select the file based file name or configure text file in
psfdirectory.(given ICADVM 18.1 ISR11, Spectre 19.1 ISR6)
reference
AC Peak Analysis Using IPWC Rapid Adoption Kit (RAK) Product Version: IC6.1.8 ISR10, SPECTRE19.1 ISR5 April 2020
Posser, Gracieli & Sapatnekar, Sachin & Reis, Ricardo. (2017). Electromigration Inside Logic Cells. 10.1007/978-3-319-48899-8.
A. B. Kahng, S. Nath and T. S. Rosing, "On potential design impacts of electromigration awareness," 2013 18th Asia and South Pacific Design Automation Conference (ASP-DAC), 2013, pp. 527-532, doi: 10.1109/ASPDAC.2013.6509650.
Kumar, Neeraj and Mohammad S. Hashmi. “Study, analysis and modeling of electromigration in SRAMs.” (2014).
N. S. Nagaraj, F. Cano, H. Haznedar and D. Young, "A practical approach to static signal electromigration analysis," Proceedings 1998 Design and Automation Conference. 35th DAC. (Cat. No.98CH36175), 1998, pp. 572-577, doi: 10.1109/DAC.1998.724536.
Blaauw, David & Oh, Chanhee & Zolotov, Vladimir & Dasgupta, Aurobindo. (2003). Static electromigration analysis for on-chip signal interconnects. Computer-Aided Design of Integrated Circuits and Systems, IEEE Transactions on. 22. 39 - 48. 10.1109/TCAD.2002.805728.