Phase Noise and Jitter Simulation
Phase Noise on \(log\) scale
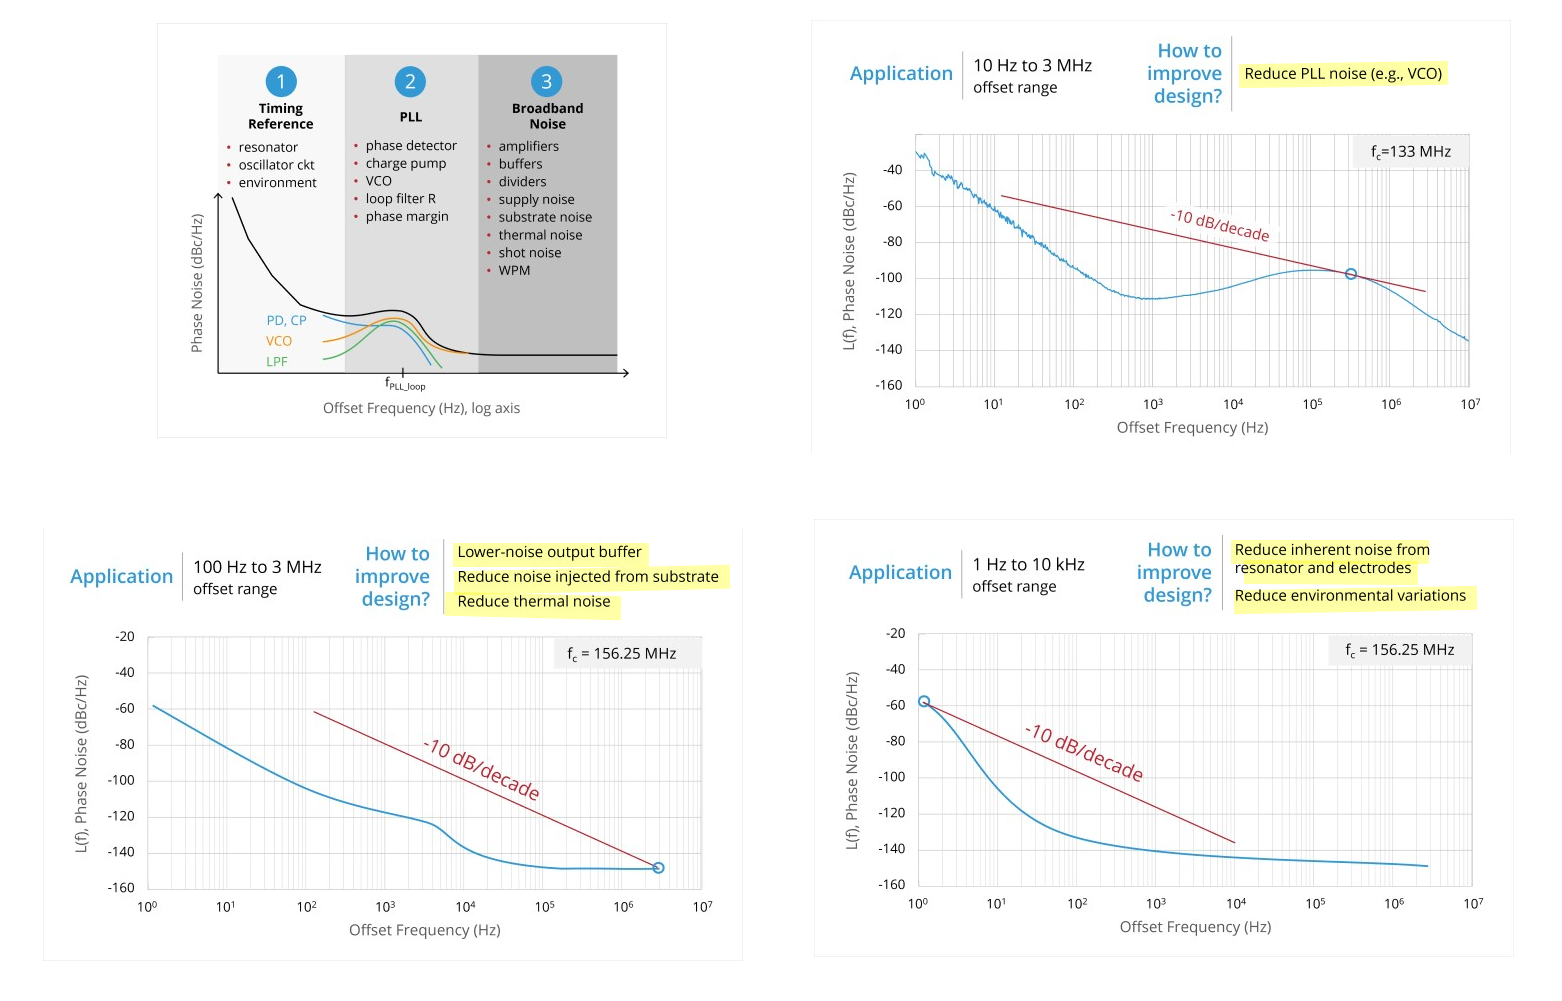
How to Identify the Source of Phase Jitter through Phase Noise Plots [https://www.sitime.com/company/newsroom/blog/how-identify-source-phase-jitter-through-phase-noise-plots]
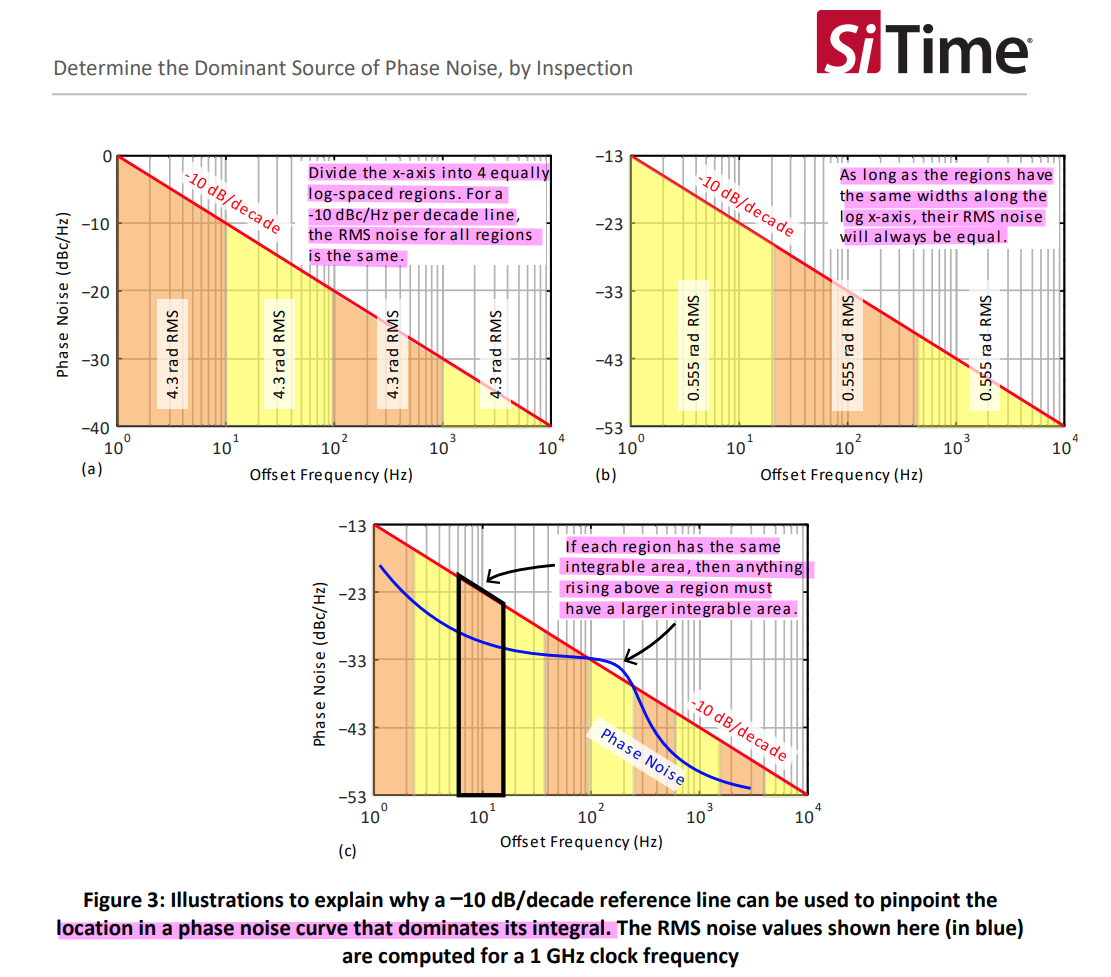
AN10072 Determine the Dominant Source of Phase Noise, by Inspection [https://www.sitime.com/support/resource-library/application-notes/an10072-determine-dominant-source-phase-noise-inspection]
4-minute Clinic: Determine the Dominant Source of Jitter by Inspection of Phase Noise Plot [https://youtu.be/2elHk3v45Pk]
Chembian Thambidurai, "Integrated Power of Thermal and Flicker Noise" [link]
a -10 dB/decade reference line can be used to pinpoint the location in a phase noise curve that dominates its integral
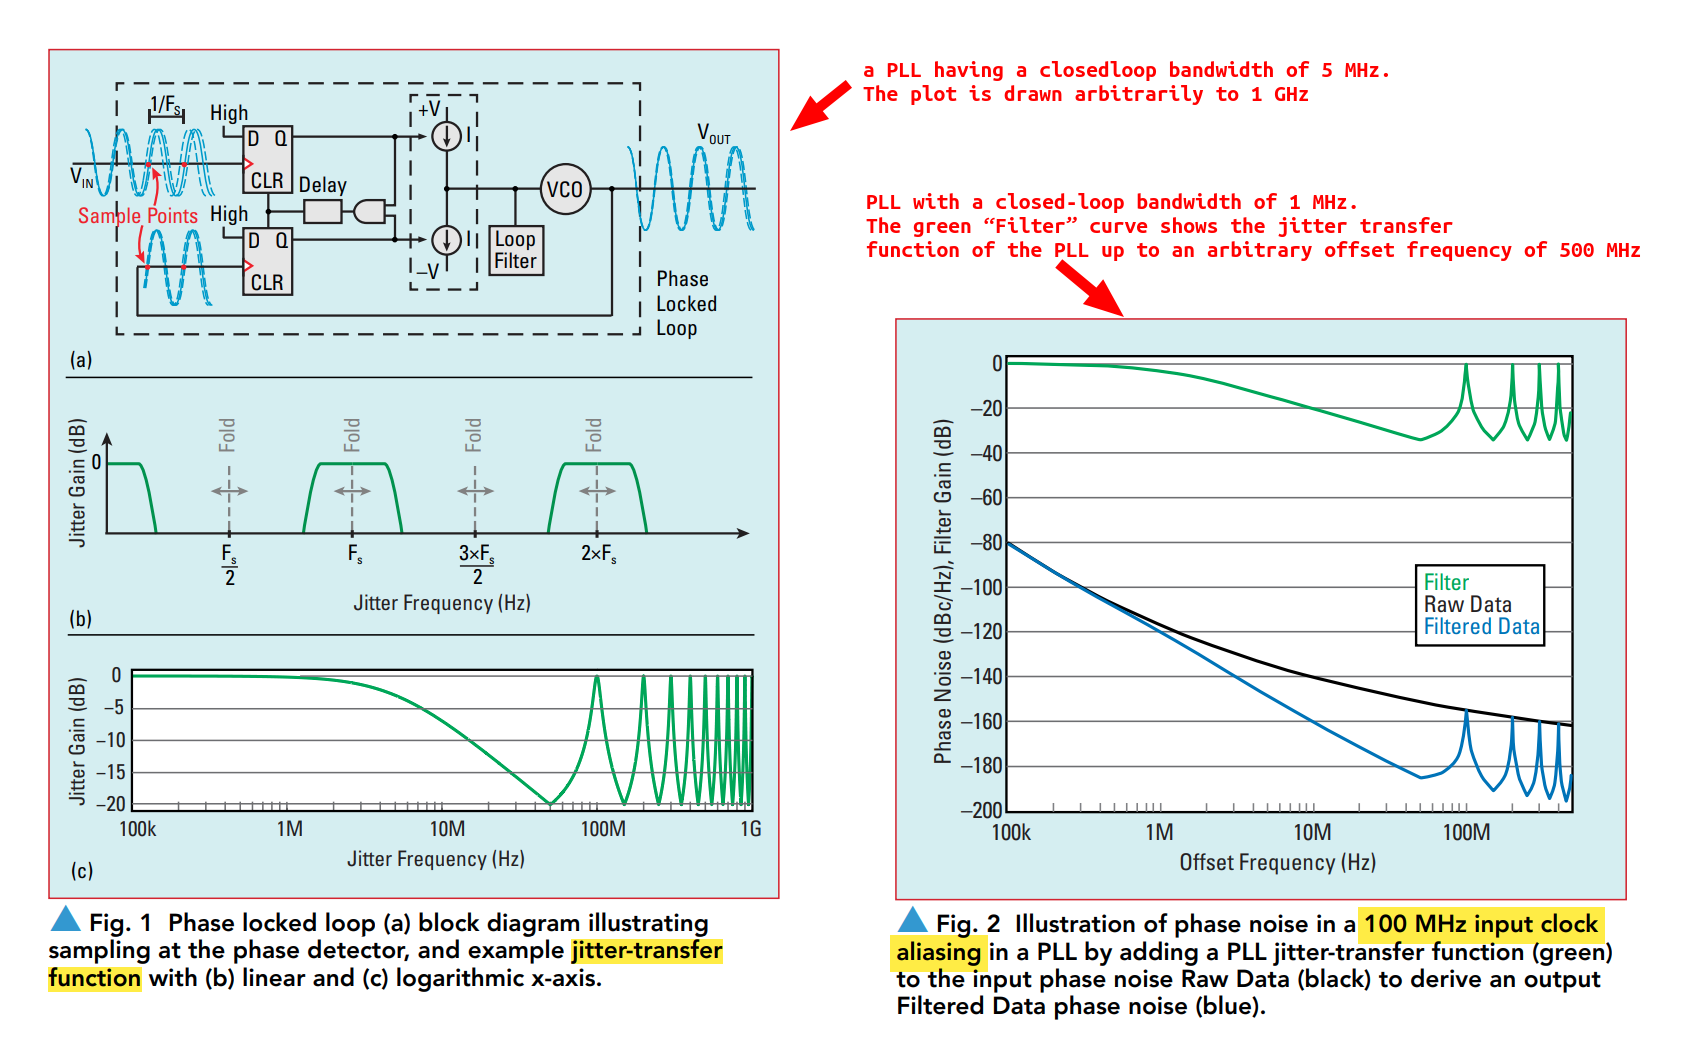
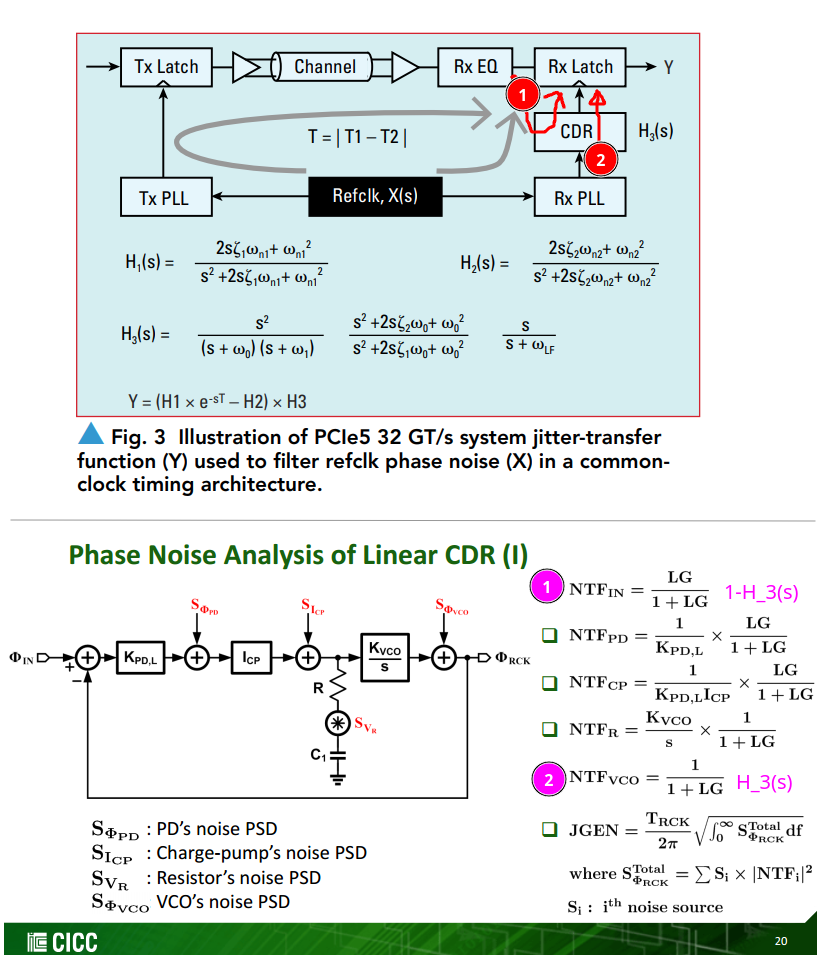
Reference-Clock Phase Noise in PLL
Gary Giust. How to Evaluate Reference-Clock Phase Noise in High-Speed Serial Links [expanded version], [compact version]
G. Richmond, "Refclk Fanout Best Practices for 8GT/s and 16GT/s Systems," PCI-SIG Developers Conference, June 7, 2017
Knowing how input phase noise aliases when sampled by a PLL
An alternate view of phase noise aliasing during the sampling process
- Instead of mirroring the jitter-transfer function located below \(F_S/2\) across spectral boundaries located at integer multiples of \(F_S/2\) (i.e. 50 MHz) as shown in Figure 2 (a)
- we could alternatively fold the portion of the Raw Data curve located above \(F_S/2\) across these spectrum boundaries to appear below \(F_S/2\) as shown in Figure 2 (b)
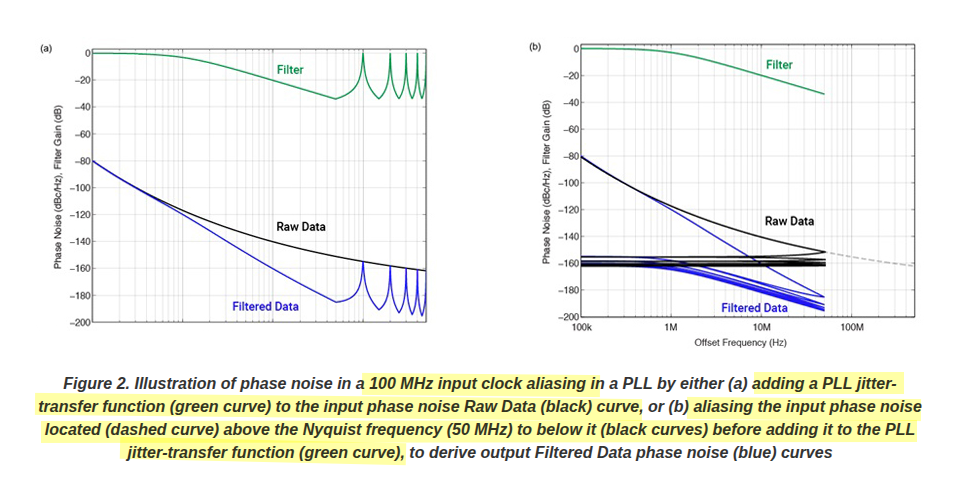
Integrating the combined area under each Filtered Data curve shown in Figure 2 (b) is mathematically equivalent to integrating the entire Filtered Data curve shown in Figure 2 (a)
Phase Noise Analyzer vs TIE jitter using Real-time Oscilloscope
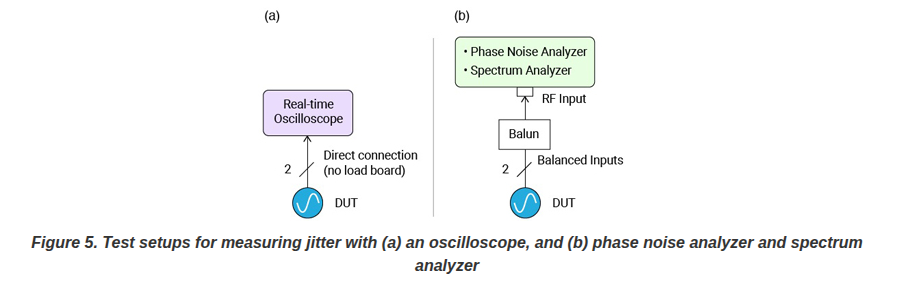
Since an oscilloscope observes jitter similar to a real system, we regard its result as the gold standard against which other methods may be judged
Flat Phase Noise Extension to twice the clock frequency
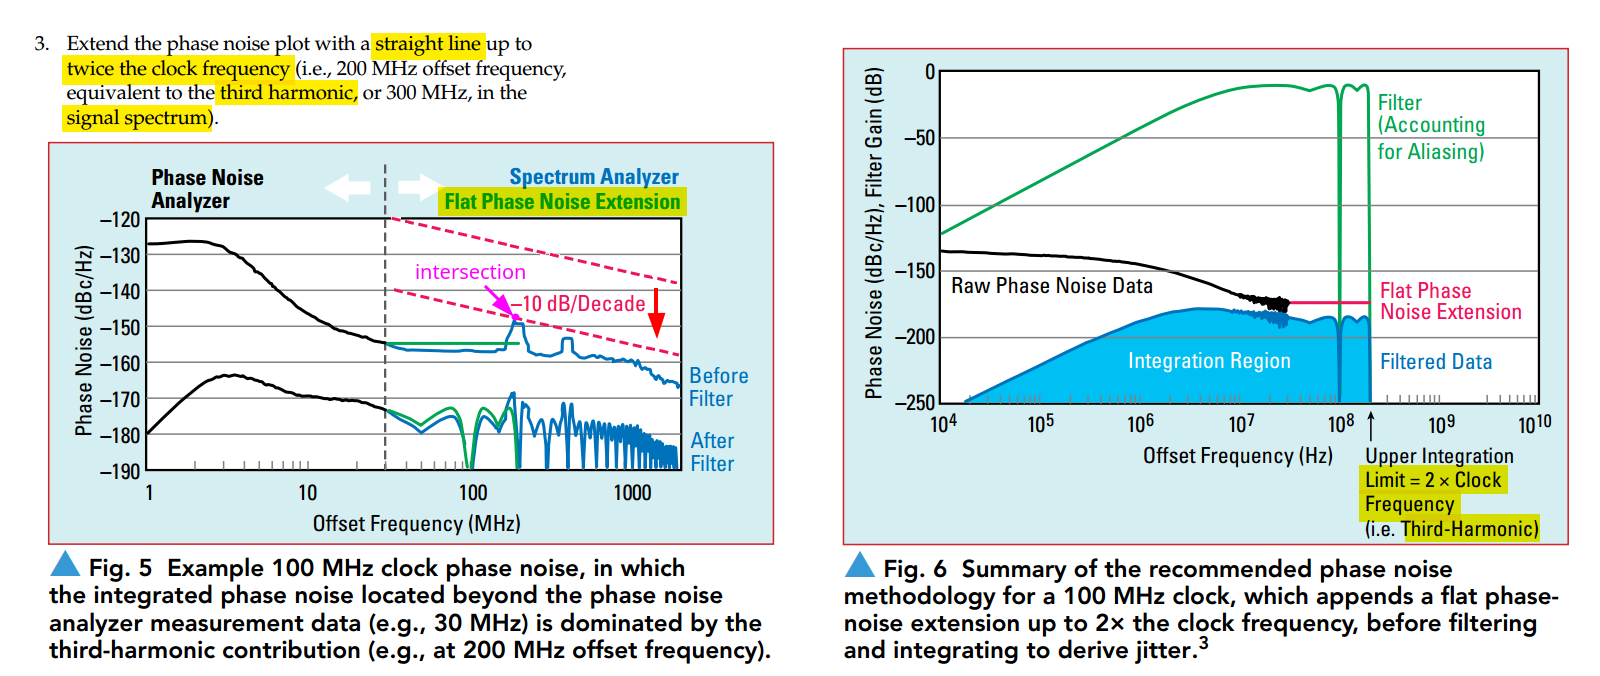
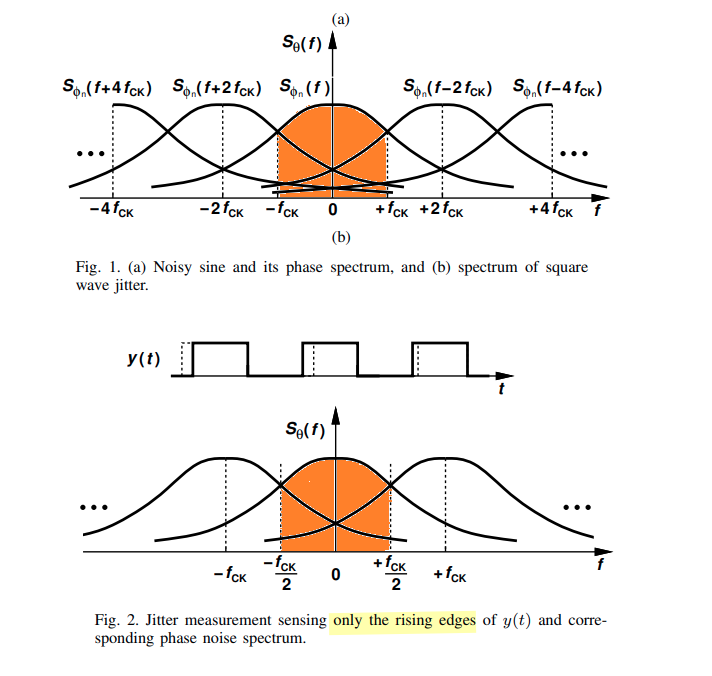
Phase Noise Aliasing & Integration Limits
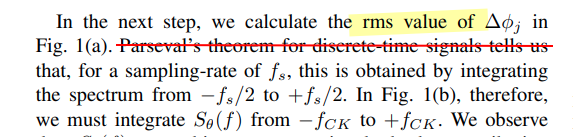
These two types of measurements deliver the same rms jitter of \(f_{CK}\)
- both rising and falling: integrated from \(-f_{CK}\) to \(+f_{CK}\)
- only the rising (or falling) edges: integrated from \(-f_{CK}/2\) to \(+f_{CK}/2\)
temporal autocorrelation and Wiener-Khinchin theorem is more appropriate to arise rms value
Y. Zhao and B. Razavi, "Phase Noise Integration Limits for Jitter Calculation,"[https://www.seas.ucla.edu/brweb/papers/Conferences/YZ_ISCAS_22.pdf]
G. Giust, "Phase Noise Aliases as TIE Jitter," Signal Integrity Journal, July 23, 2018 [https://www.signalintegrityjournal.com/articles/912-phase-noise-aliases-as-tie-jitter]
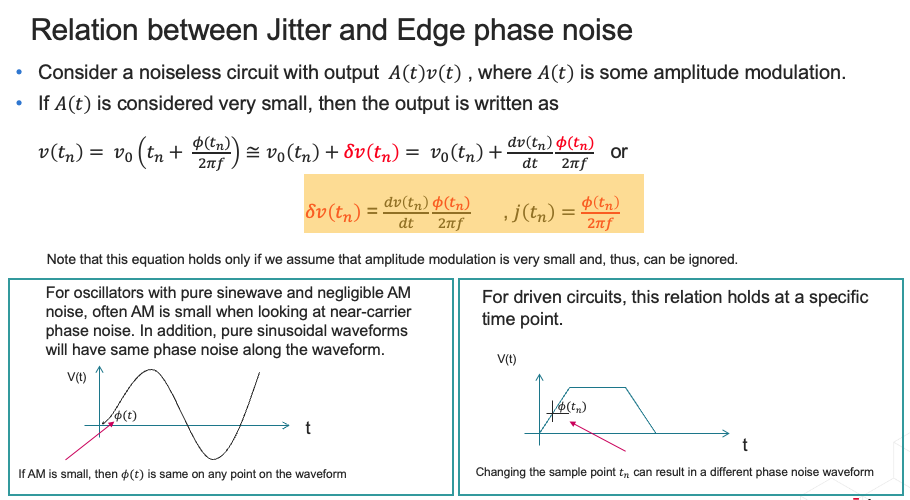
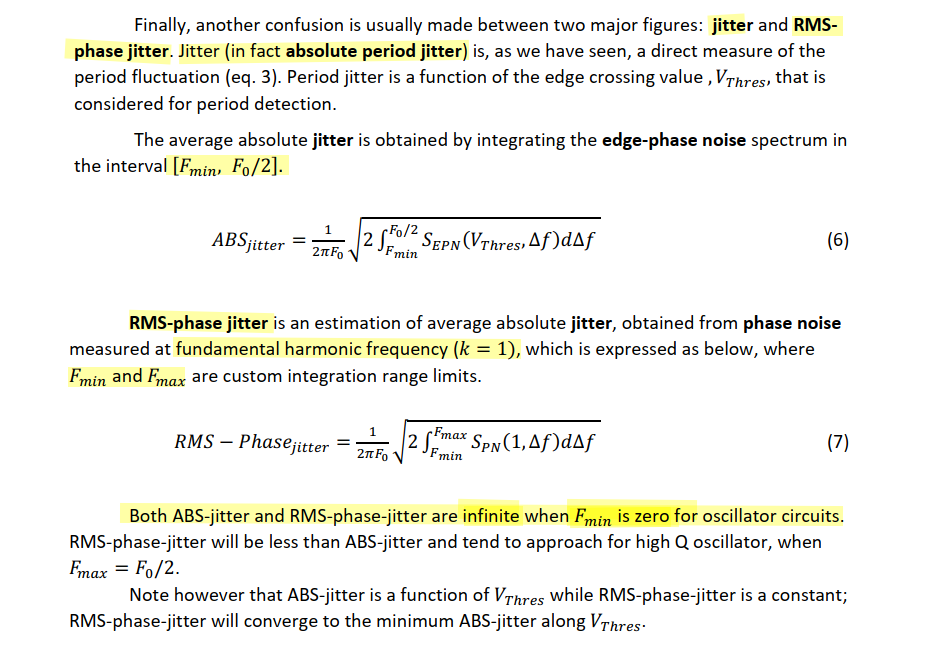
Jitter and Edge phase noise
Shawn Logan, Summary of Study of Cadence Sampled Phase Noise and Jitter Definitions with a Comparison to Conventional Time Interval Error (TIE) for a Driven Circuit [www.dropbox.com/s/3m531dl4fl7bwbr/jee_computation_example_sml_032823v1p0.pdf]
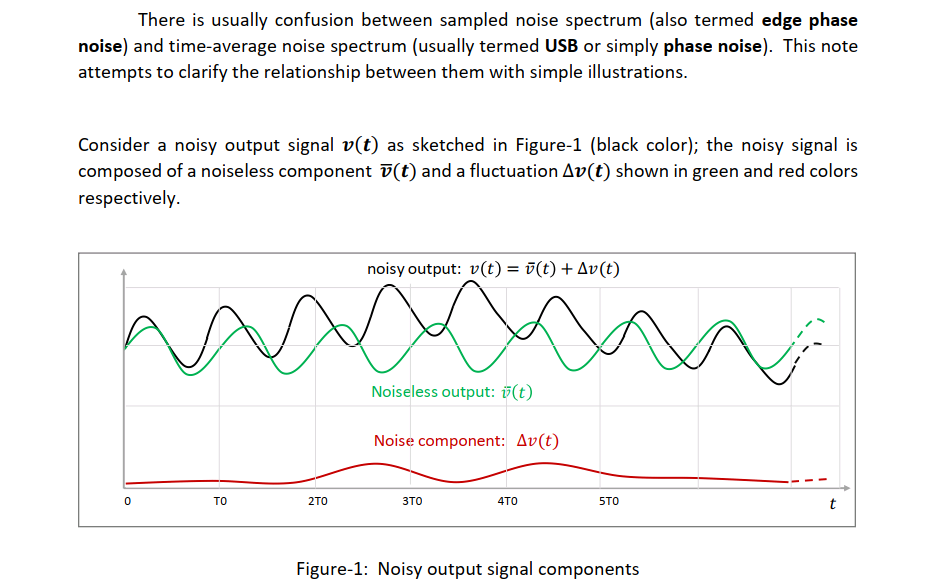
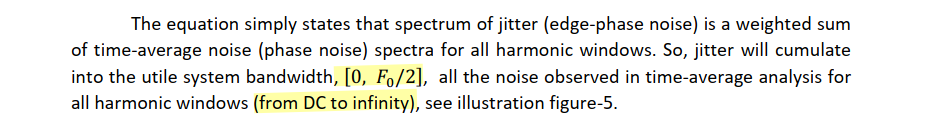
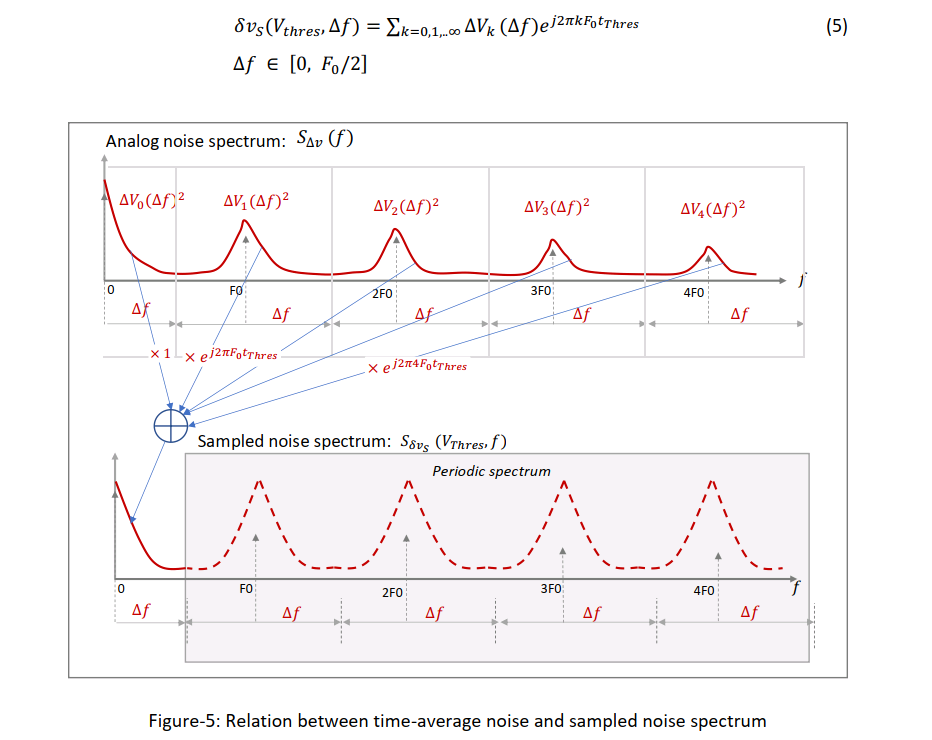
timeaverage noise (phase-noise) & sampled noise (edge-phase noise or jitter) spectrum
Time-average noise analysis
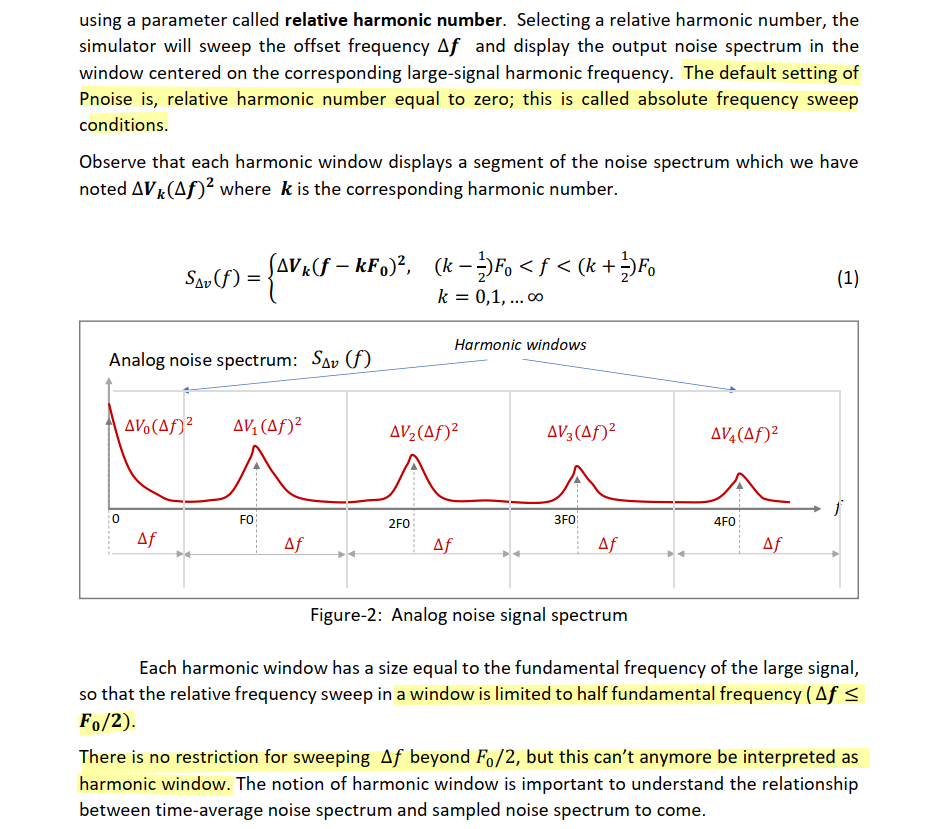
\(S_{\Delta f}(f)\) between \([\Delta f, F_0/2]\) may be less than that of other harmonic window
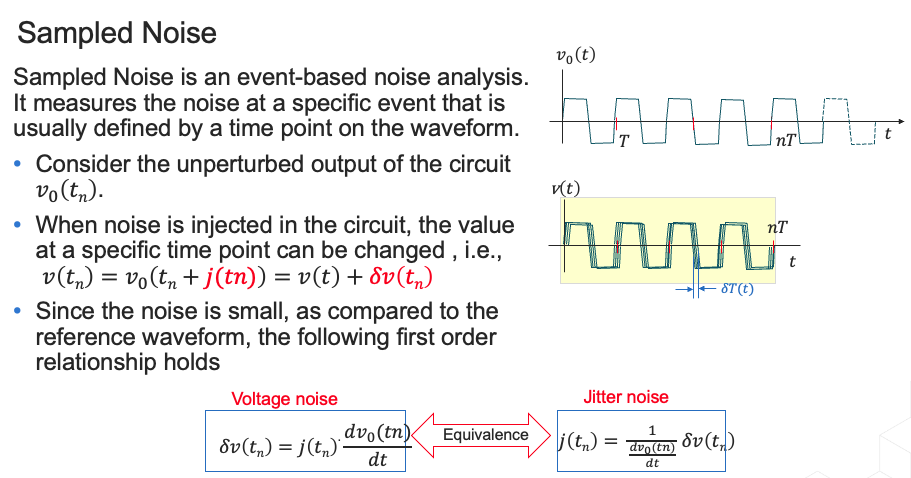
Sampled noise analysis
correlation
VCO Phase Noise
pnoise - timeaverage
Direct Plot/Pnoise/Phase Noise or
manually calculate by definition

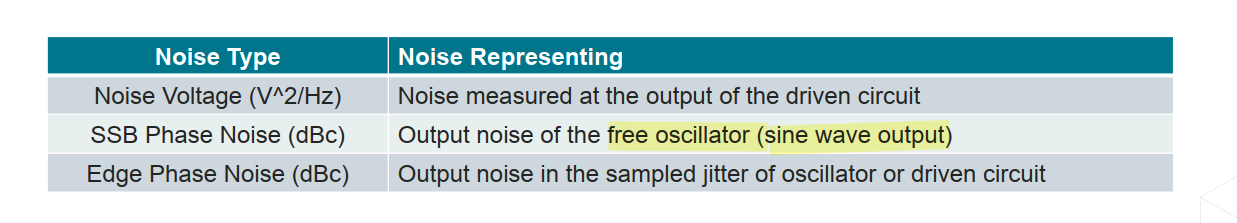
output noisewith unitdBcDirect Plot/Pnoise/Output Noise Units:dBc/Hz and Noise convention: SSB

The above method 2 and 3 only apply to
timeaveagepnoise simulation,
pnoise - sampled(jitter)/Edge Crossing

Direct Plot/Pnoise/Edge Phase Noise or

Another way, the following equation can also be used for
sampled(jitter)/Edge Crossing
1 | PhaseNoise(dBc/Hz) = dB20( OutputNoise(V/sqrt(Hz)) / slopeCrossing / Tper*twoPi ) - dB10(2) |
where dB10(2) is used to obtain SSB from DSB
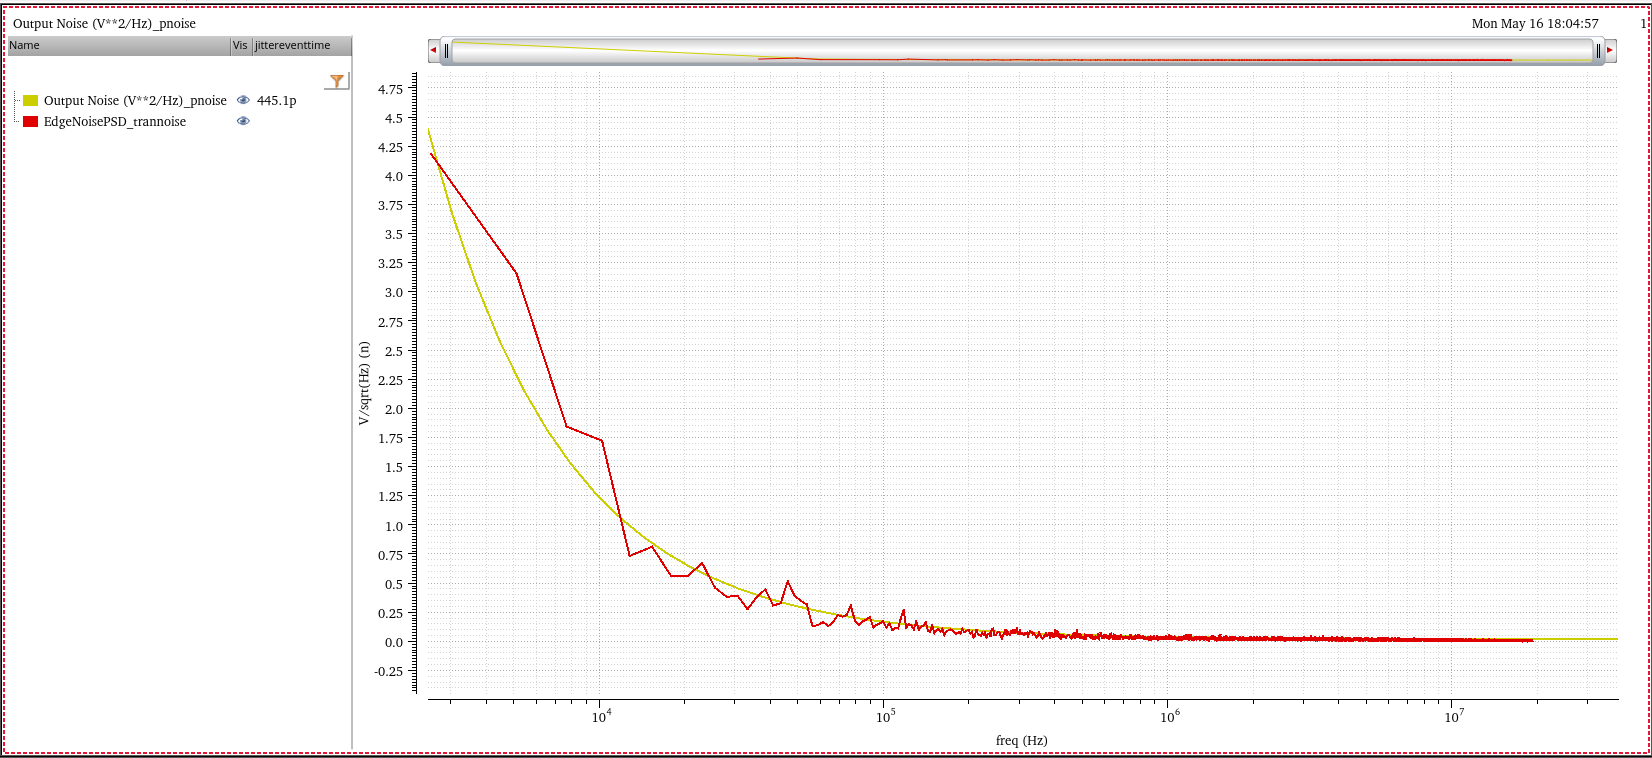
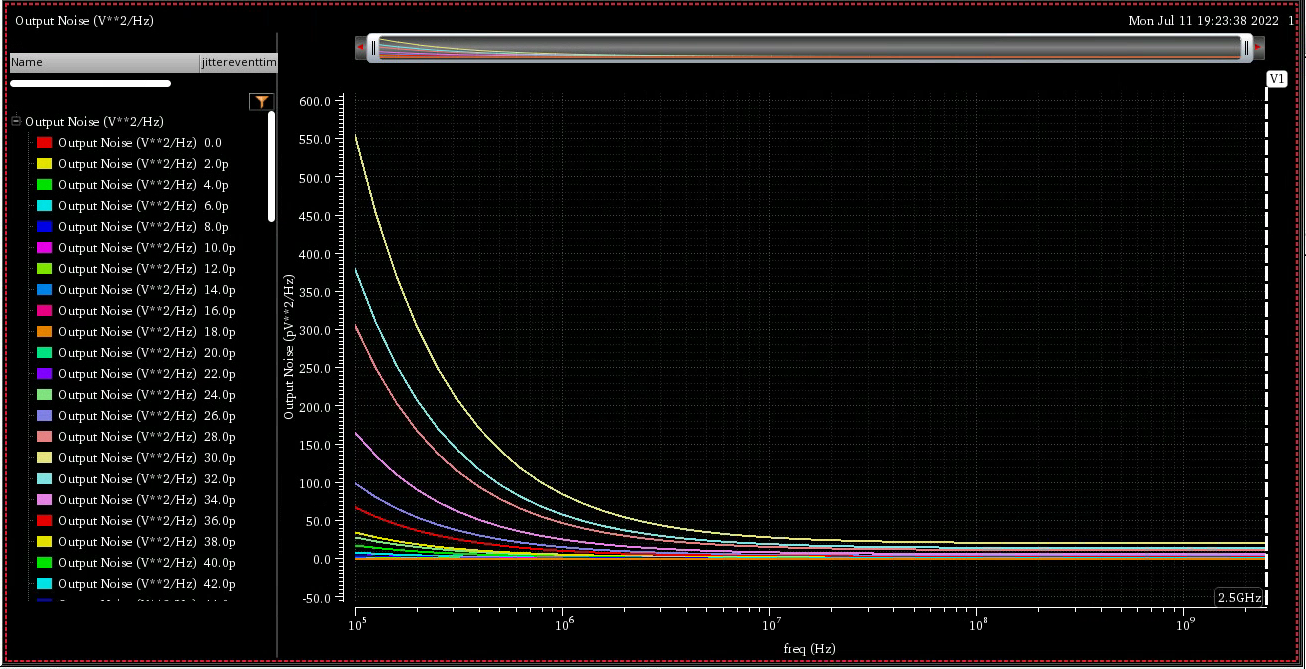
Output Noise of sampled(jitter) pnoise
The last section's Output Noise (V**2/Hz) can be
obtained by transient noise simulation
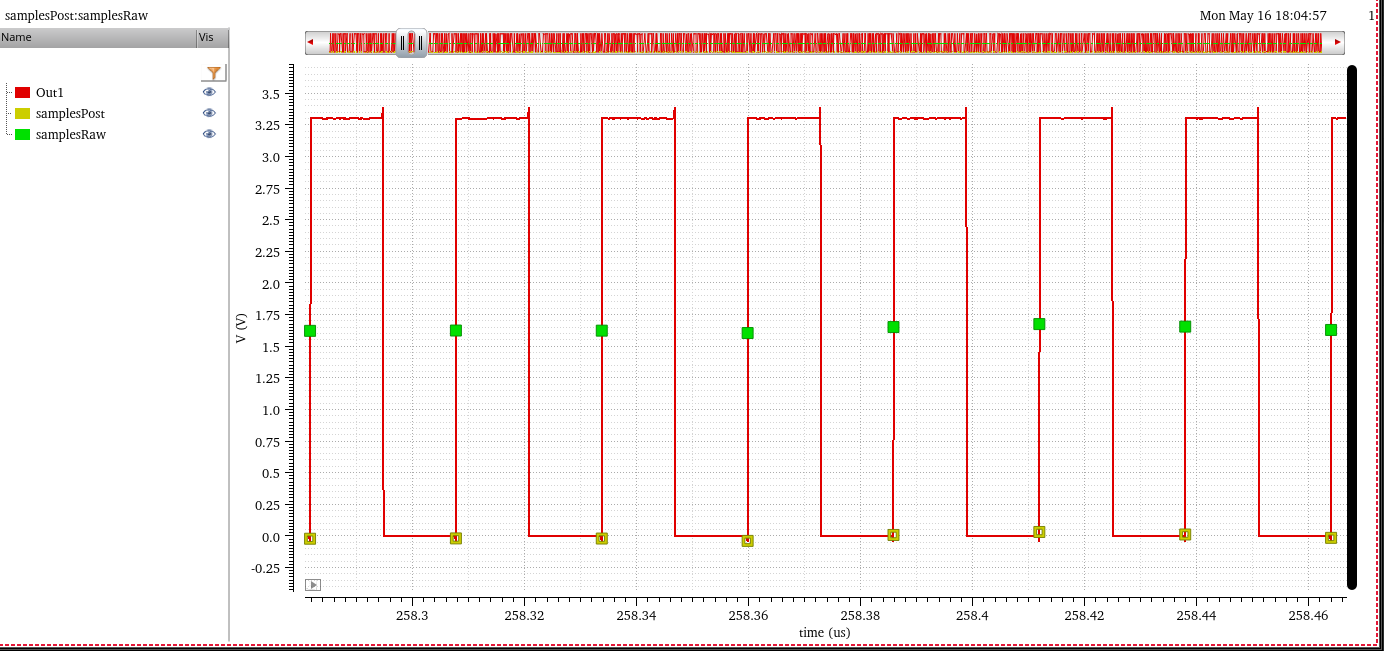
The idea is that sample waveform with ideal clock, subtract DC offset, then fft(psd)
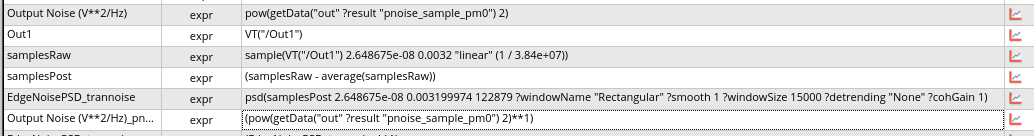
- samplesRaw = sample(wv)
- samplePost = samplesRaw - average(samplesRaw)
- Output Noise (V**2/Hz) = psd(samplePost)
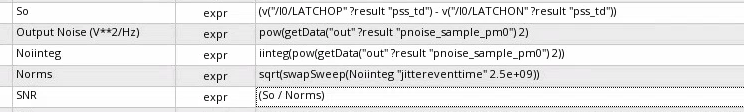
Expression:
The computation cost is typically very high, and the accuracy is lesser as compared to PSS/Pnoise
Pnoise Sampled(jitter): Sampled Phase Option
- Identical to noisetype=timedomain in old GUI
- Use model:
- Sampleds Per Period: number of ponits
- Add Specific Points: specific time point, still time points
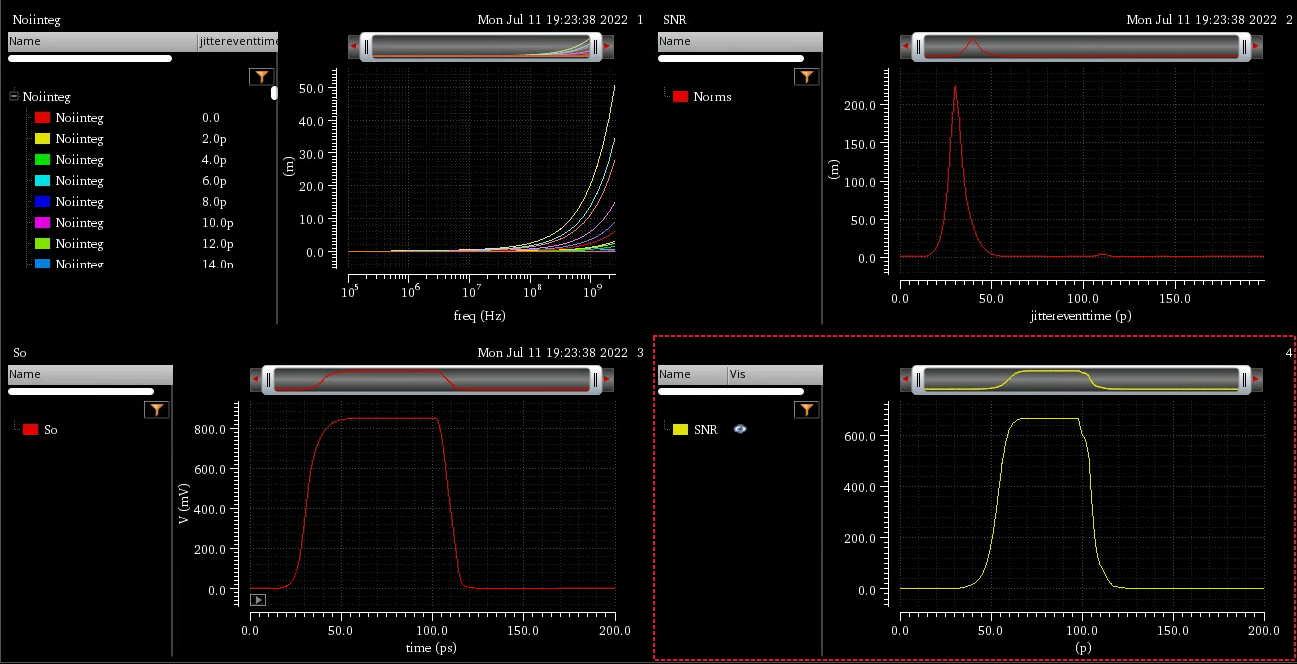
pss beat freq = 5GHz
pnoise sweeptype: absolute, from 100k to 2.5GHz
Transient noise
phase noise from transient noise analysis
- The Phase Noise function is now available in the Direct Plot form
(Results-Direct Plot-Main Form) after Transient Analysis is run
- Absolute jitter Method
- Direct Power Spectral Density Method
PNphase noise function- Absolute jitter Method
- Direct Power Spectral Density Method
Absolute jitter Method: Phase noise is defined as the power spectral density of the absolute jitter of an input waveform
and absolute jitter method is the default method
In below discussion, we only think about the
absolute jitter method
PSD & Phase Noise
- phase noise is single-sideband
- psd is double-sideband
- Then the ratio is 2
By PSS_Pnoise
jee
1 | rfEdgePhaseNoise(?result "pnoise_sample_pm0" ?eventList 'nil) + 10 * log10(2) |
convert single-sideband phase noise to psd by multiplying 2 or
10 * log10(2)
By trannoise PN function
1 | PN(clip(VT("/Out1") 2.60417e-08 0.000400052) "rising" 1.65 ?Tnom (1 / 3.84e+07) ?windowName "Rectangular" ?smooth 1 ?windowSize 15000 ?detrending "None" ?cohGain 1 ?methodType "absJitter") |
double-sideband psd
By trannoise psd and abs_jitter
function
1 | dB10(psd(abs_jitter(clip(VT("/Out1") 2.60417e-08 0.000400052) "rising" 1.65 ?Tnom (1 / 3.84e+07)) 2.60417e-08 0.000400052 15360 ?windowName "Rectangular" ?smooth 1 ?windowSize 15000 ?detrending "None" ?cohGain 1)) |
double-sideband psd
abs_jitterY-Unit default israd
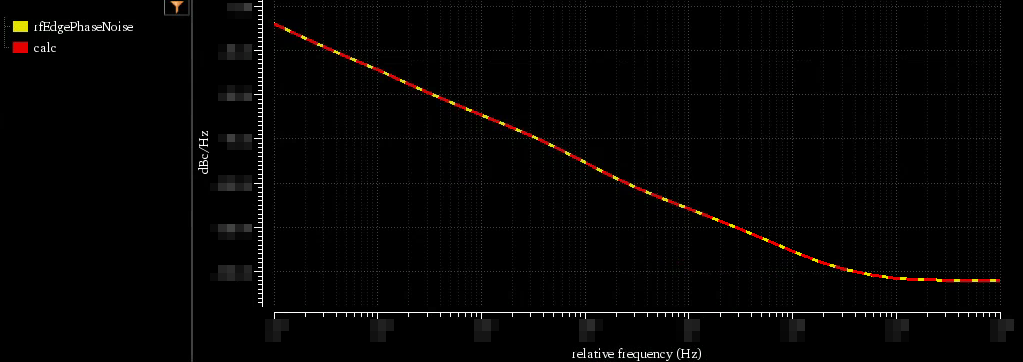
Comparison
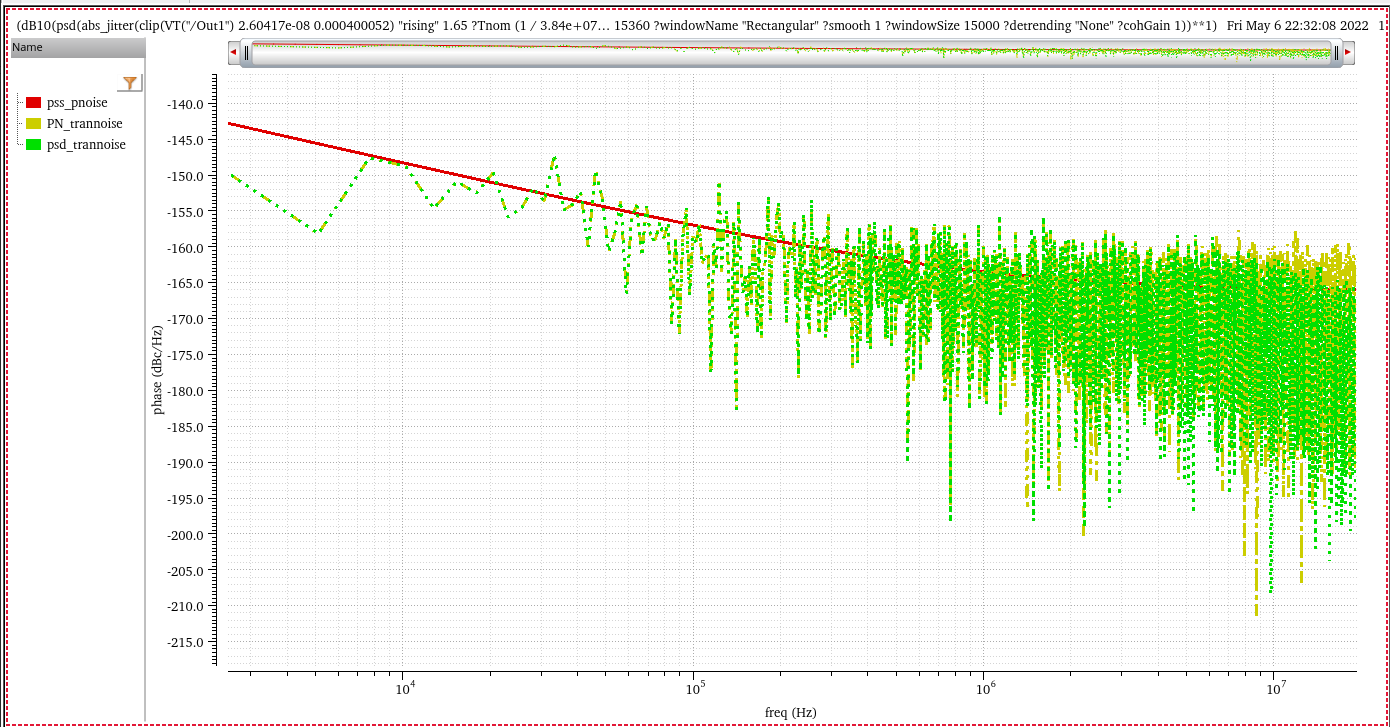
PN's result is same withpsd's
RMS value
- build the
abs_jitterfunction with seconds as the Y axis and add thestddevfunction to determine the Jee jitter value - or integrate psd
The RMS \(x_{\text{RMS}}\) of a discrete domain signal \(x(n)\) is given by \[ x_{\text{RMS}}=\sqrt{\frac{1}{N}\sum_{n=0}^{N-1}|x(n)|^2} \] Inserting Parseval's theorem given by \[ \sum_{n=0}^{N-1}|x(n)|^2=\frac{1}{N}\sum_{n=0}^{N-1}|X(k)|^2 \] allows for computing the RMS from the spectrum \(X(k)\) as \[ x_{\text{RMS}}=\sqrt{\frac{1}{N^2}\sum_{n=0}^{N-1}|X(k)|^2} \]
Cadence Spectre's PN function may call
abs_jitter and psd function under the
hood.
Phase Noise in vsource
Suppose pnoise result of one block is shown as below, and the result is stimulus of following block
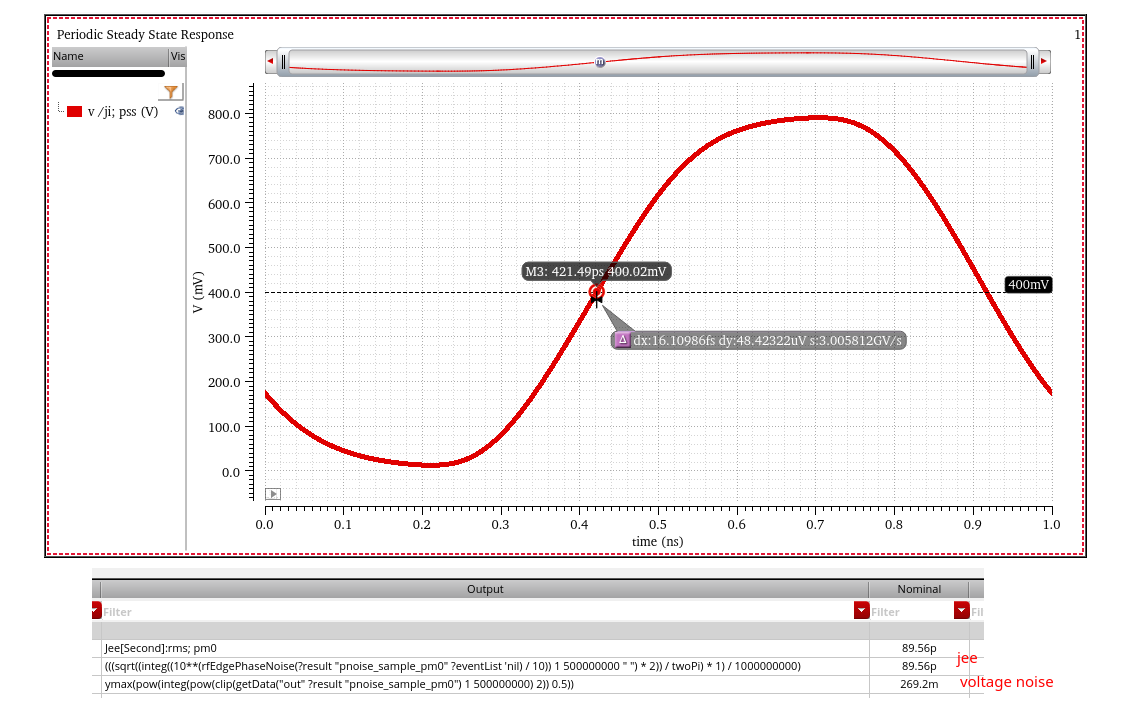
First export Output Noise and
Edge Phase Noise, then select noiseModelType
and noisefile respectively
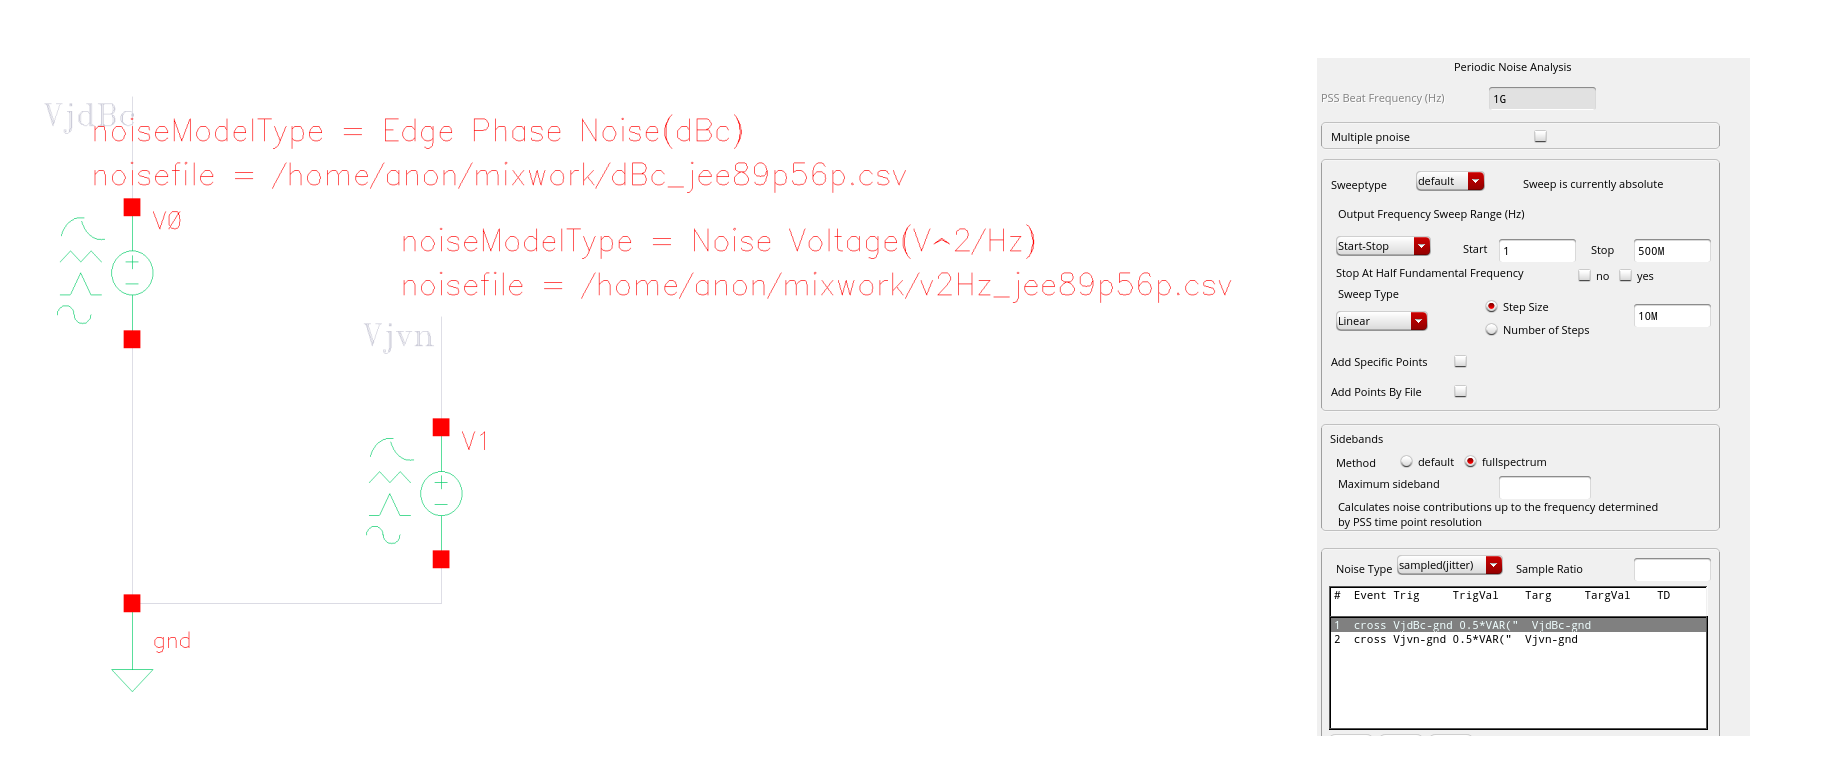
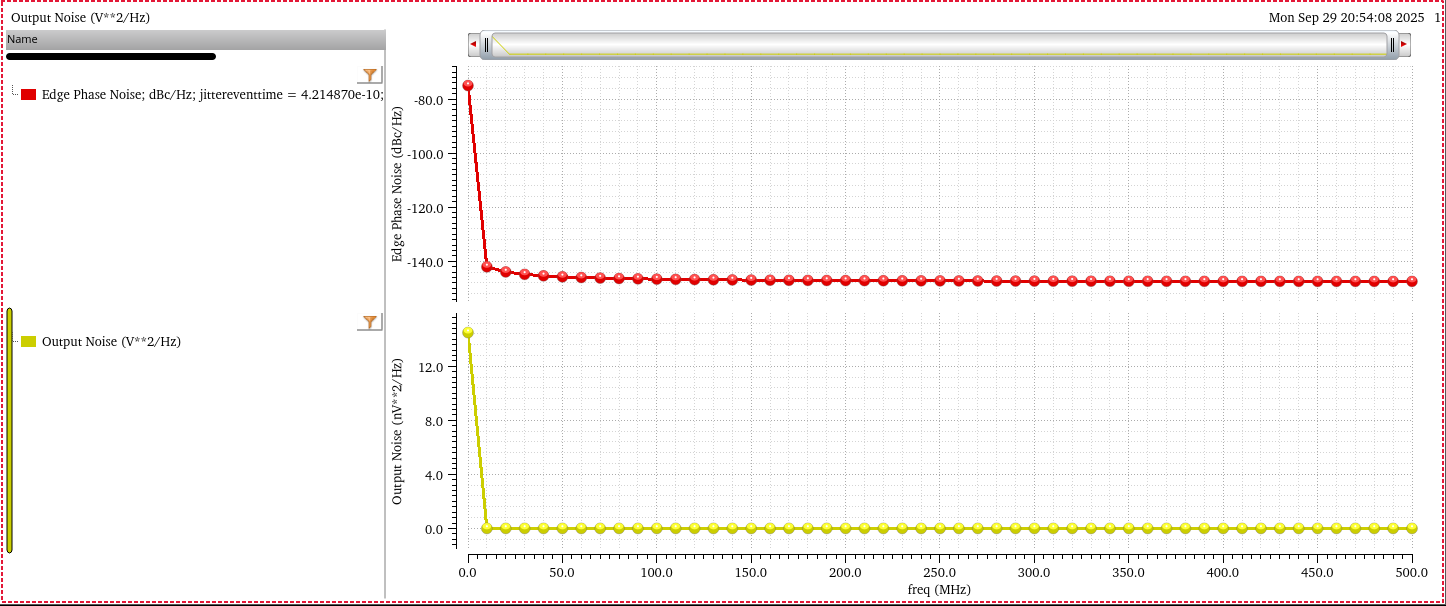
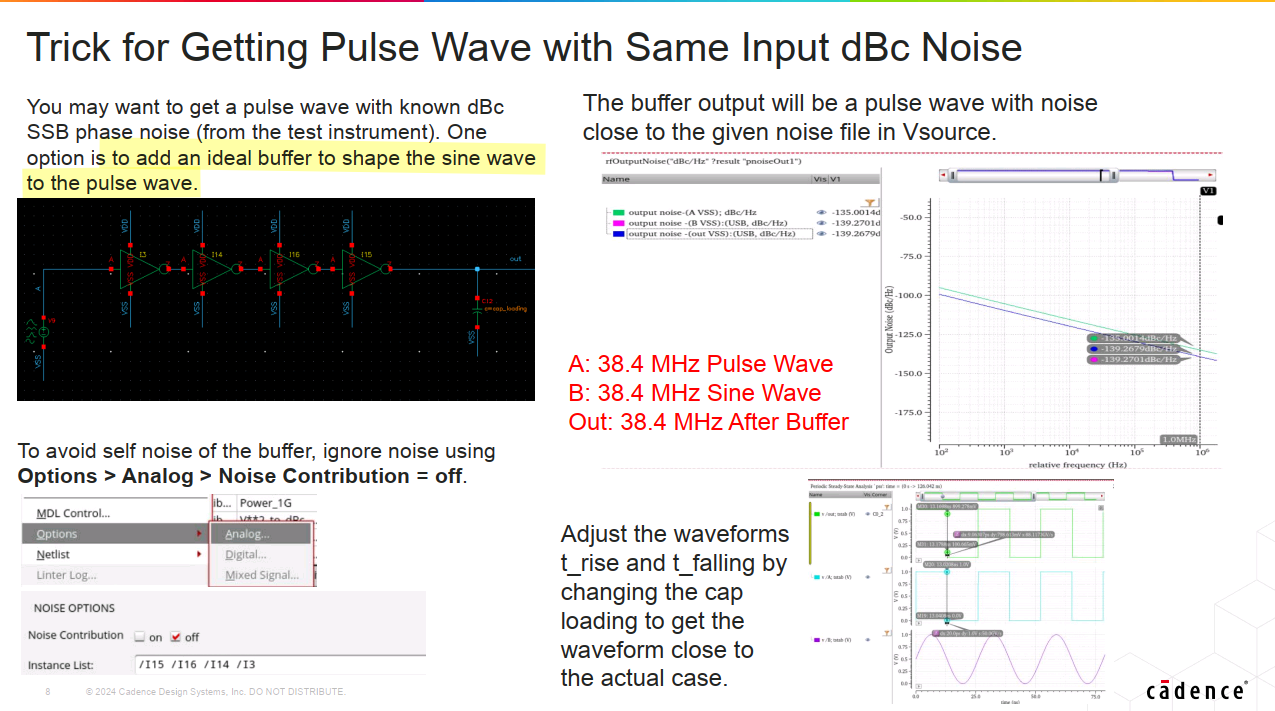
Under vsource (Source type: pulse) with
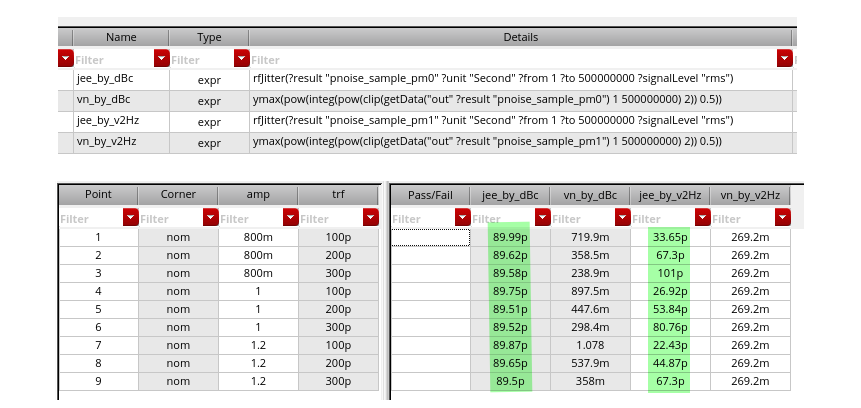
different amplitude & rising/falling time, simulation result
demonstrate that Edge Phase Noise(dBc) maintain
jitter or phase noise by tweaking voltage noise at edge
under the hoods, however Noise Voltage(V^2/Hz)
maintain voltage noise
In the conclusion, Edge Phase Noise(dBc) is
preferred for phase noise evaluation
notice:
@(#)$CDS: spectre version 21.1.0 64bit 12/01/2023 07:24 (csvcm36c-1) $
@(#)$CDS: virtuoso version ICADVM20.1-64b 10/11/2023 09:26 (cpgbld01) $
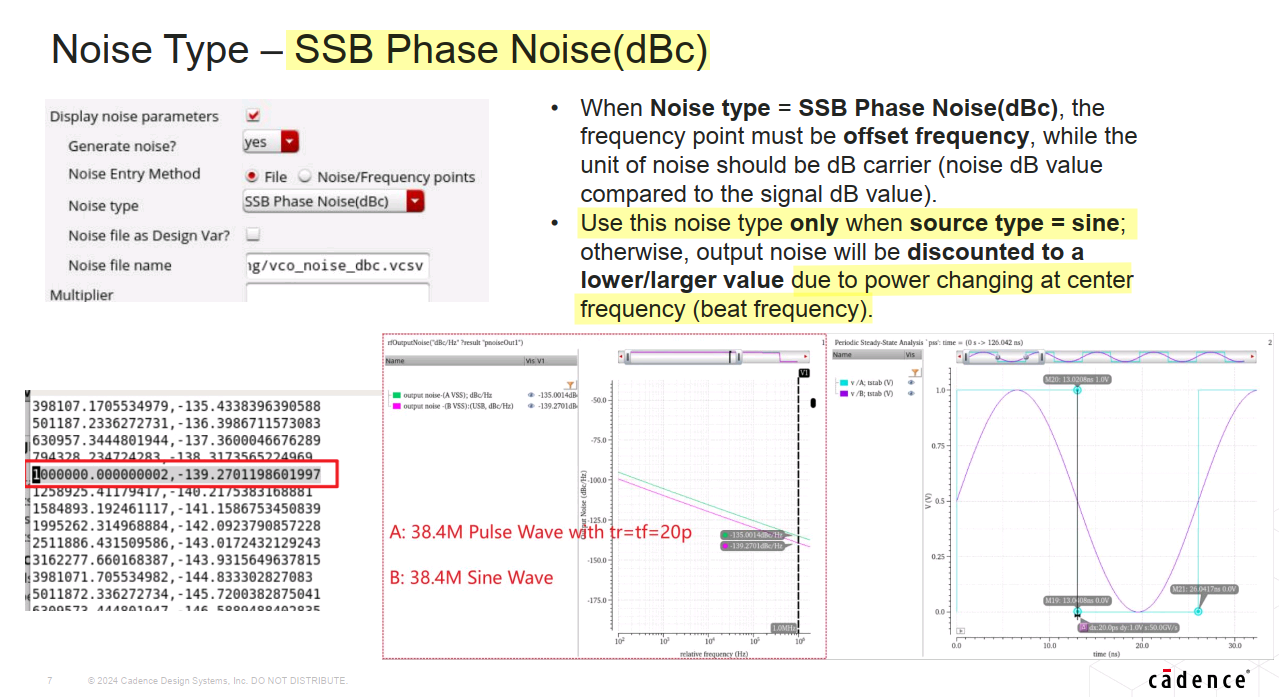
SSB Phase Noise (dBc)
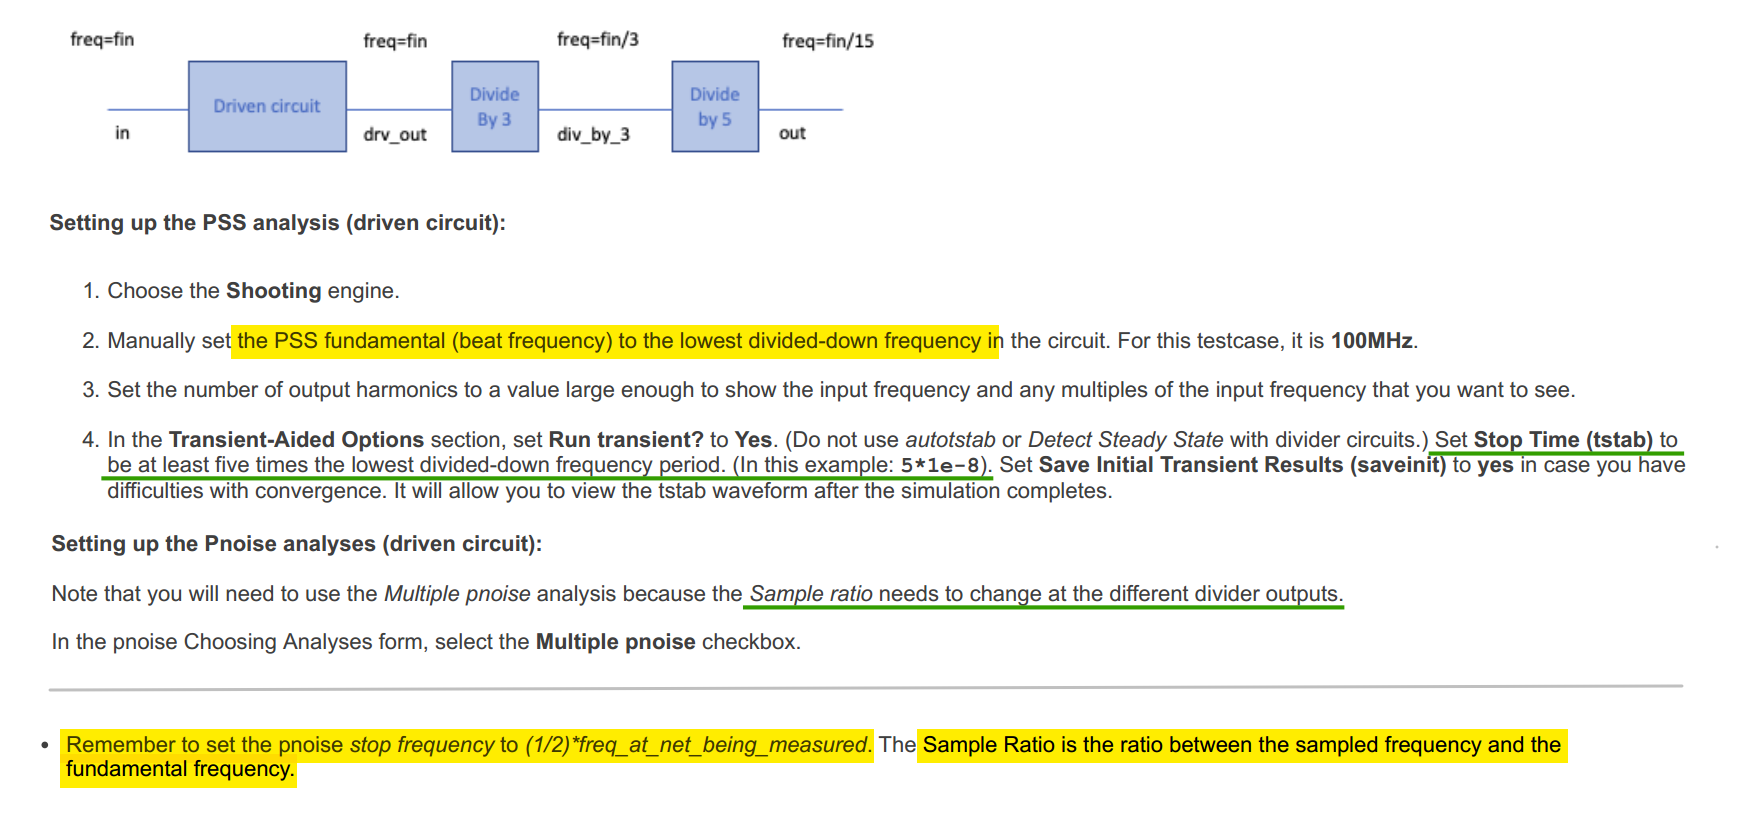
Divider PN simulation
Cadence Support. "How to set up pss/pnoise when simulating a driven circuit or a VCO, both containing dividers"
Modeling Oscillators with Arbitrary Phase Noise Profiles
TODO 📅
reference
Article (11514536) Title: How to obtain a phase noise plot from a transient noise analysis
Article (20500632) Title: How to simulate Random and Deterministic Jitters
Cadence, Application Note: Understanding the relations between time-average noise (phase-noise) and sampled noise (edge-phase noise or jitter) in Pnoise analysis
Tutorial on Scaling of the Discrete Fourier Transform and the Implied Physical Units of the Spectra of Time-Discrete Signals Jens Ahrens, Carl Andersson, Patrik Höstmad, Wolfgang Kropp URL: https://appliedacousticschalmers.github.io/scaling-of-the-dft/AES2020_eBrief/
Tawna, "Modeling Oscillators with Arbitrary Phase Noise Profiles"[https://community.cadence.com/cadence_blogs_8/b/rf/posts/modeling-oscillators-with-arbitrary-phase-noise-profiles]
—, "How to Specify Phase Noise as an Instance Parameter in Spectre Sources (e.g. vsource, isource, Port)" [https://community.cadence.com/cadence_blogs_8/b/rf/posts/how-to-specify-phase-noise-as-an-instance-parameter-in-spectre-sources-e-g-vsource-isource-port]